
EMS-1048 Solar Dashboard
Solar dashboard for photovoltaic production and consumption, making anomalies, energy flow and solar cost/revenue visibility immediate and easier to understand.
Impact
instant
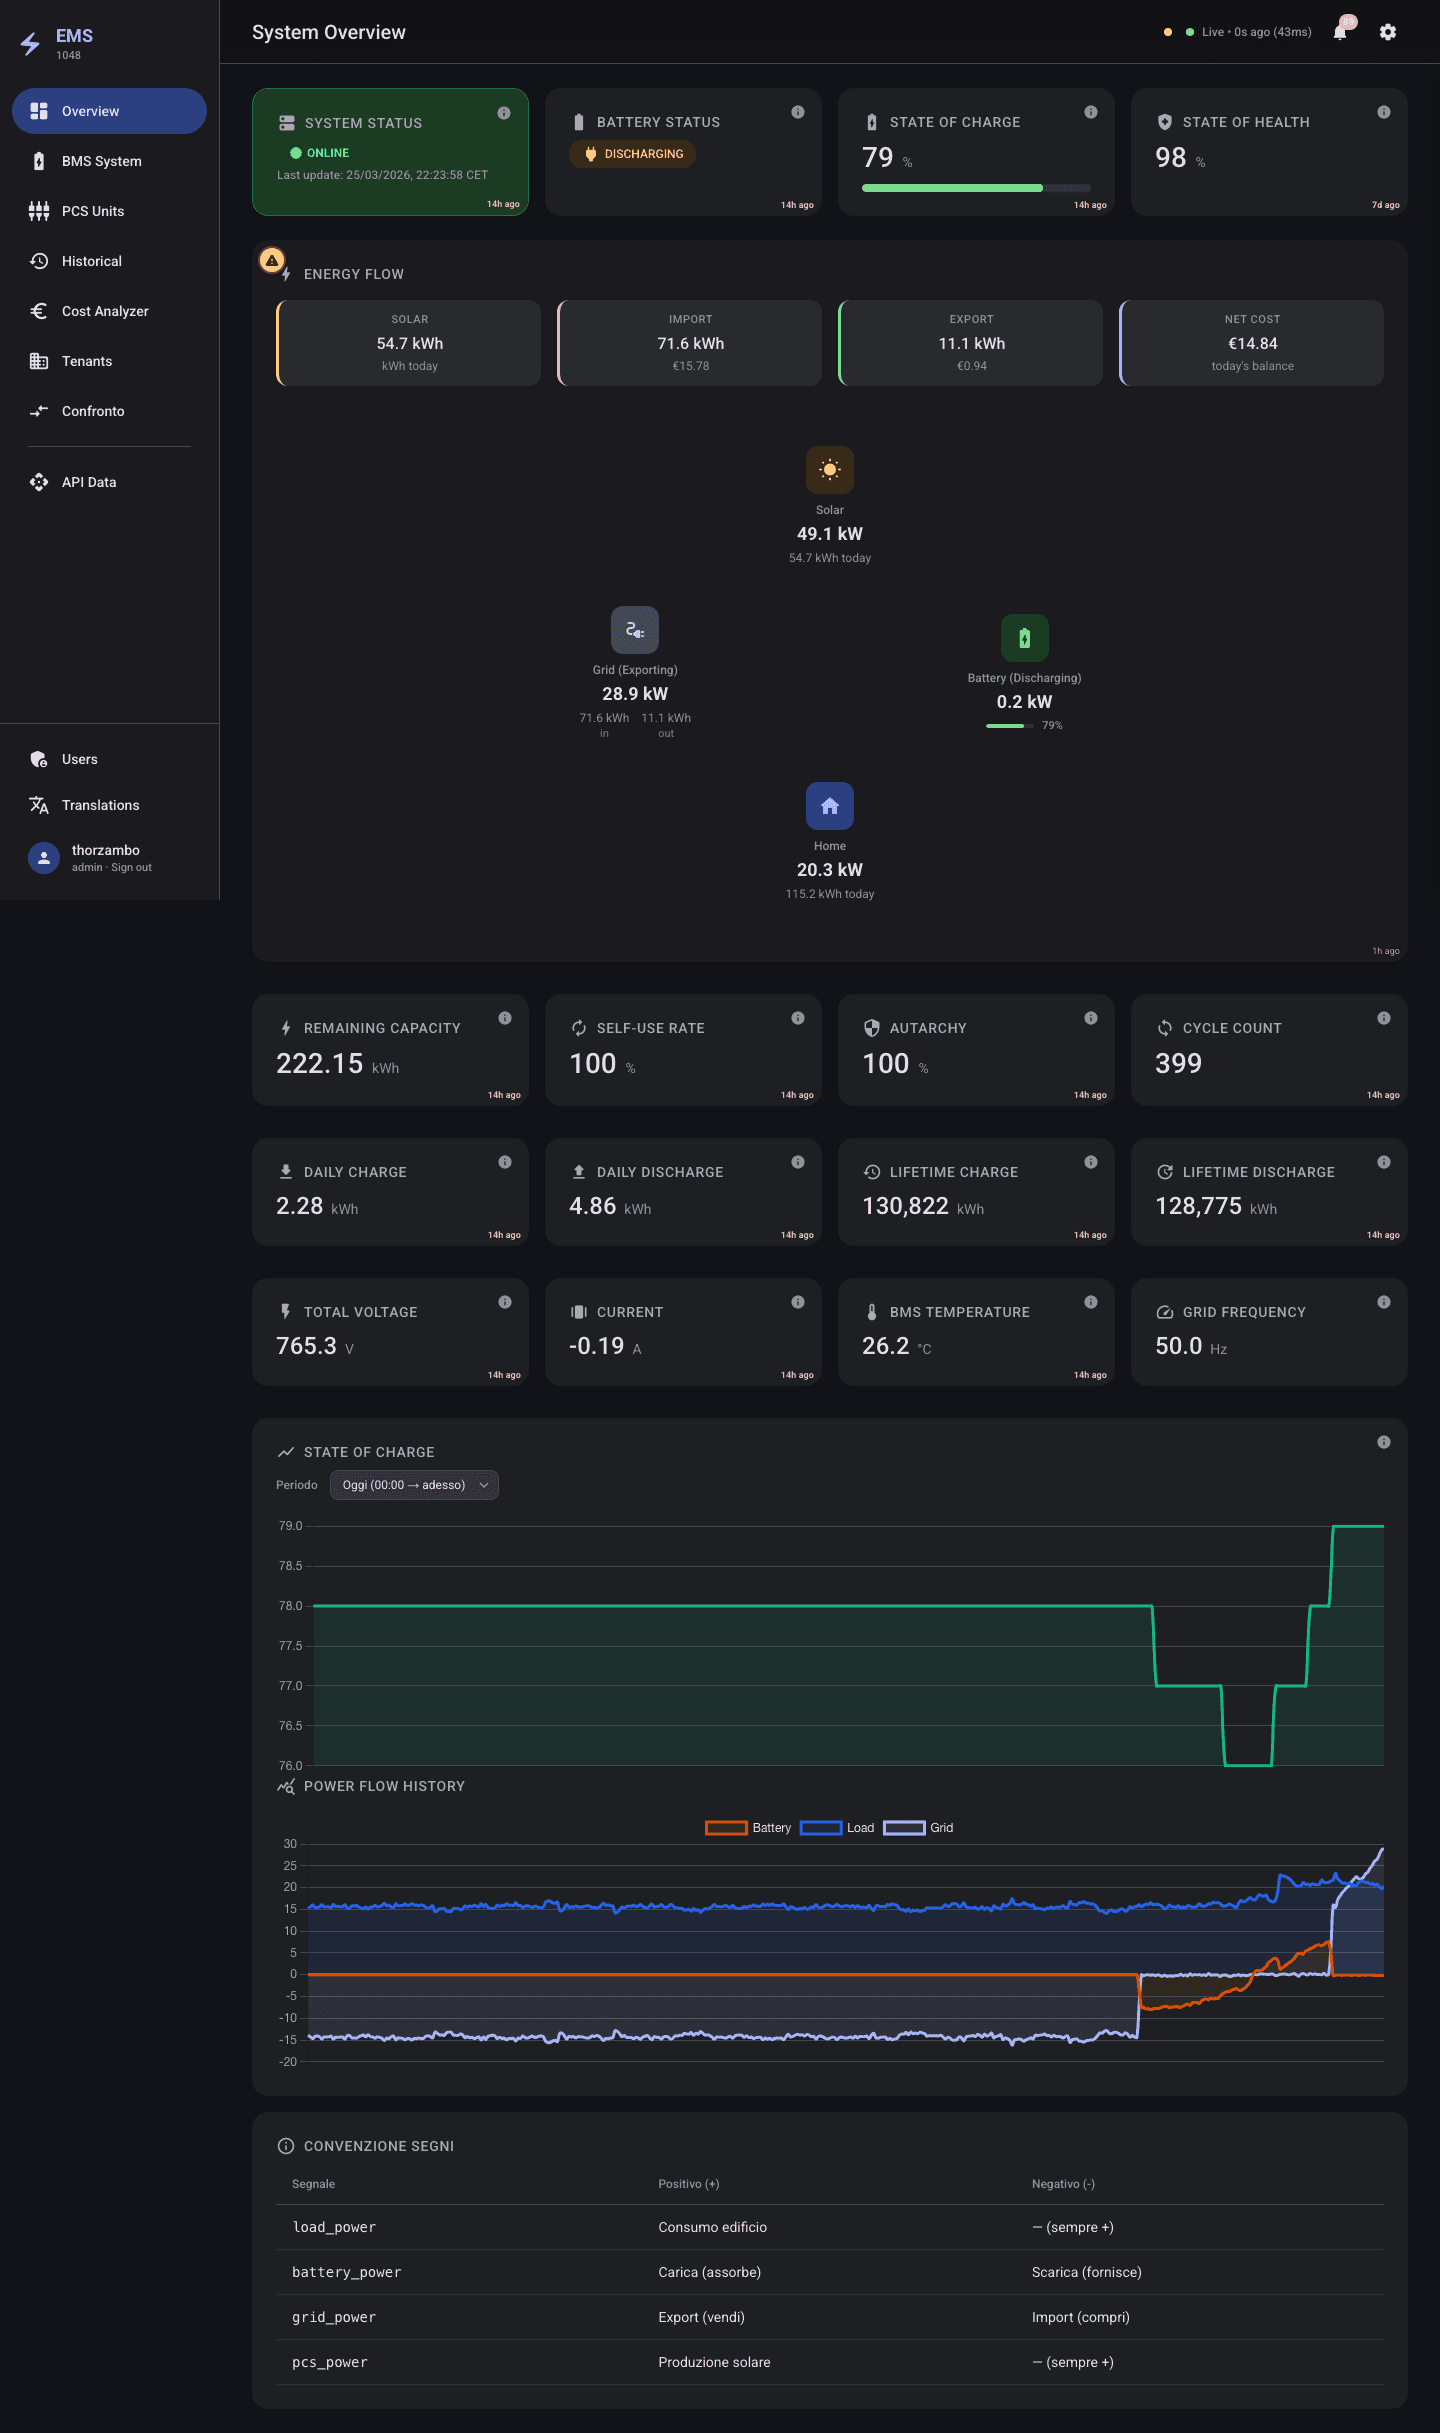
anomaly visibility
clear
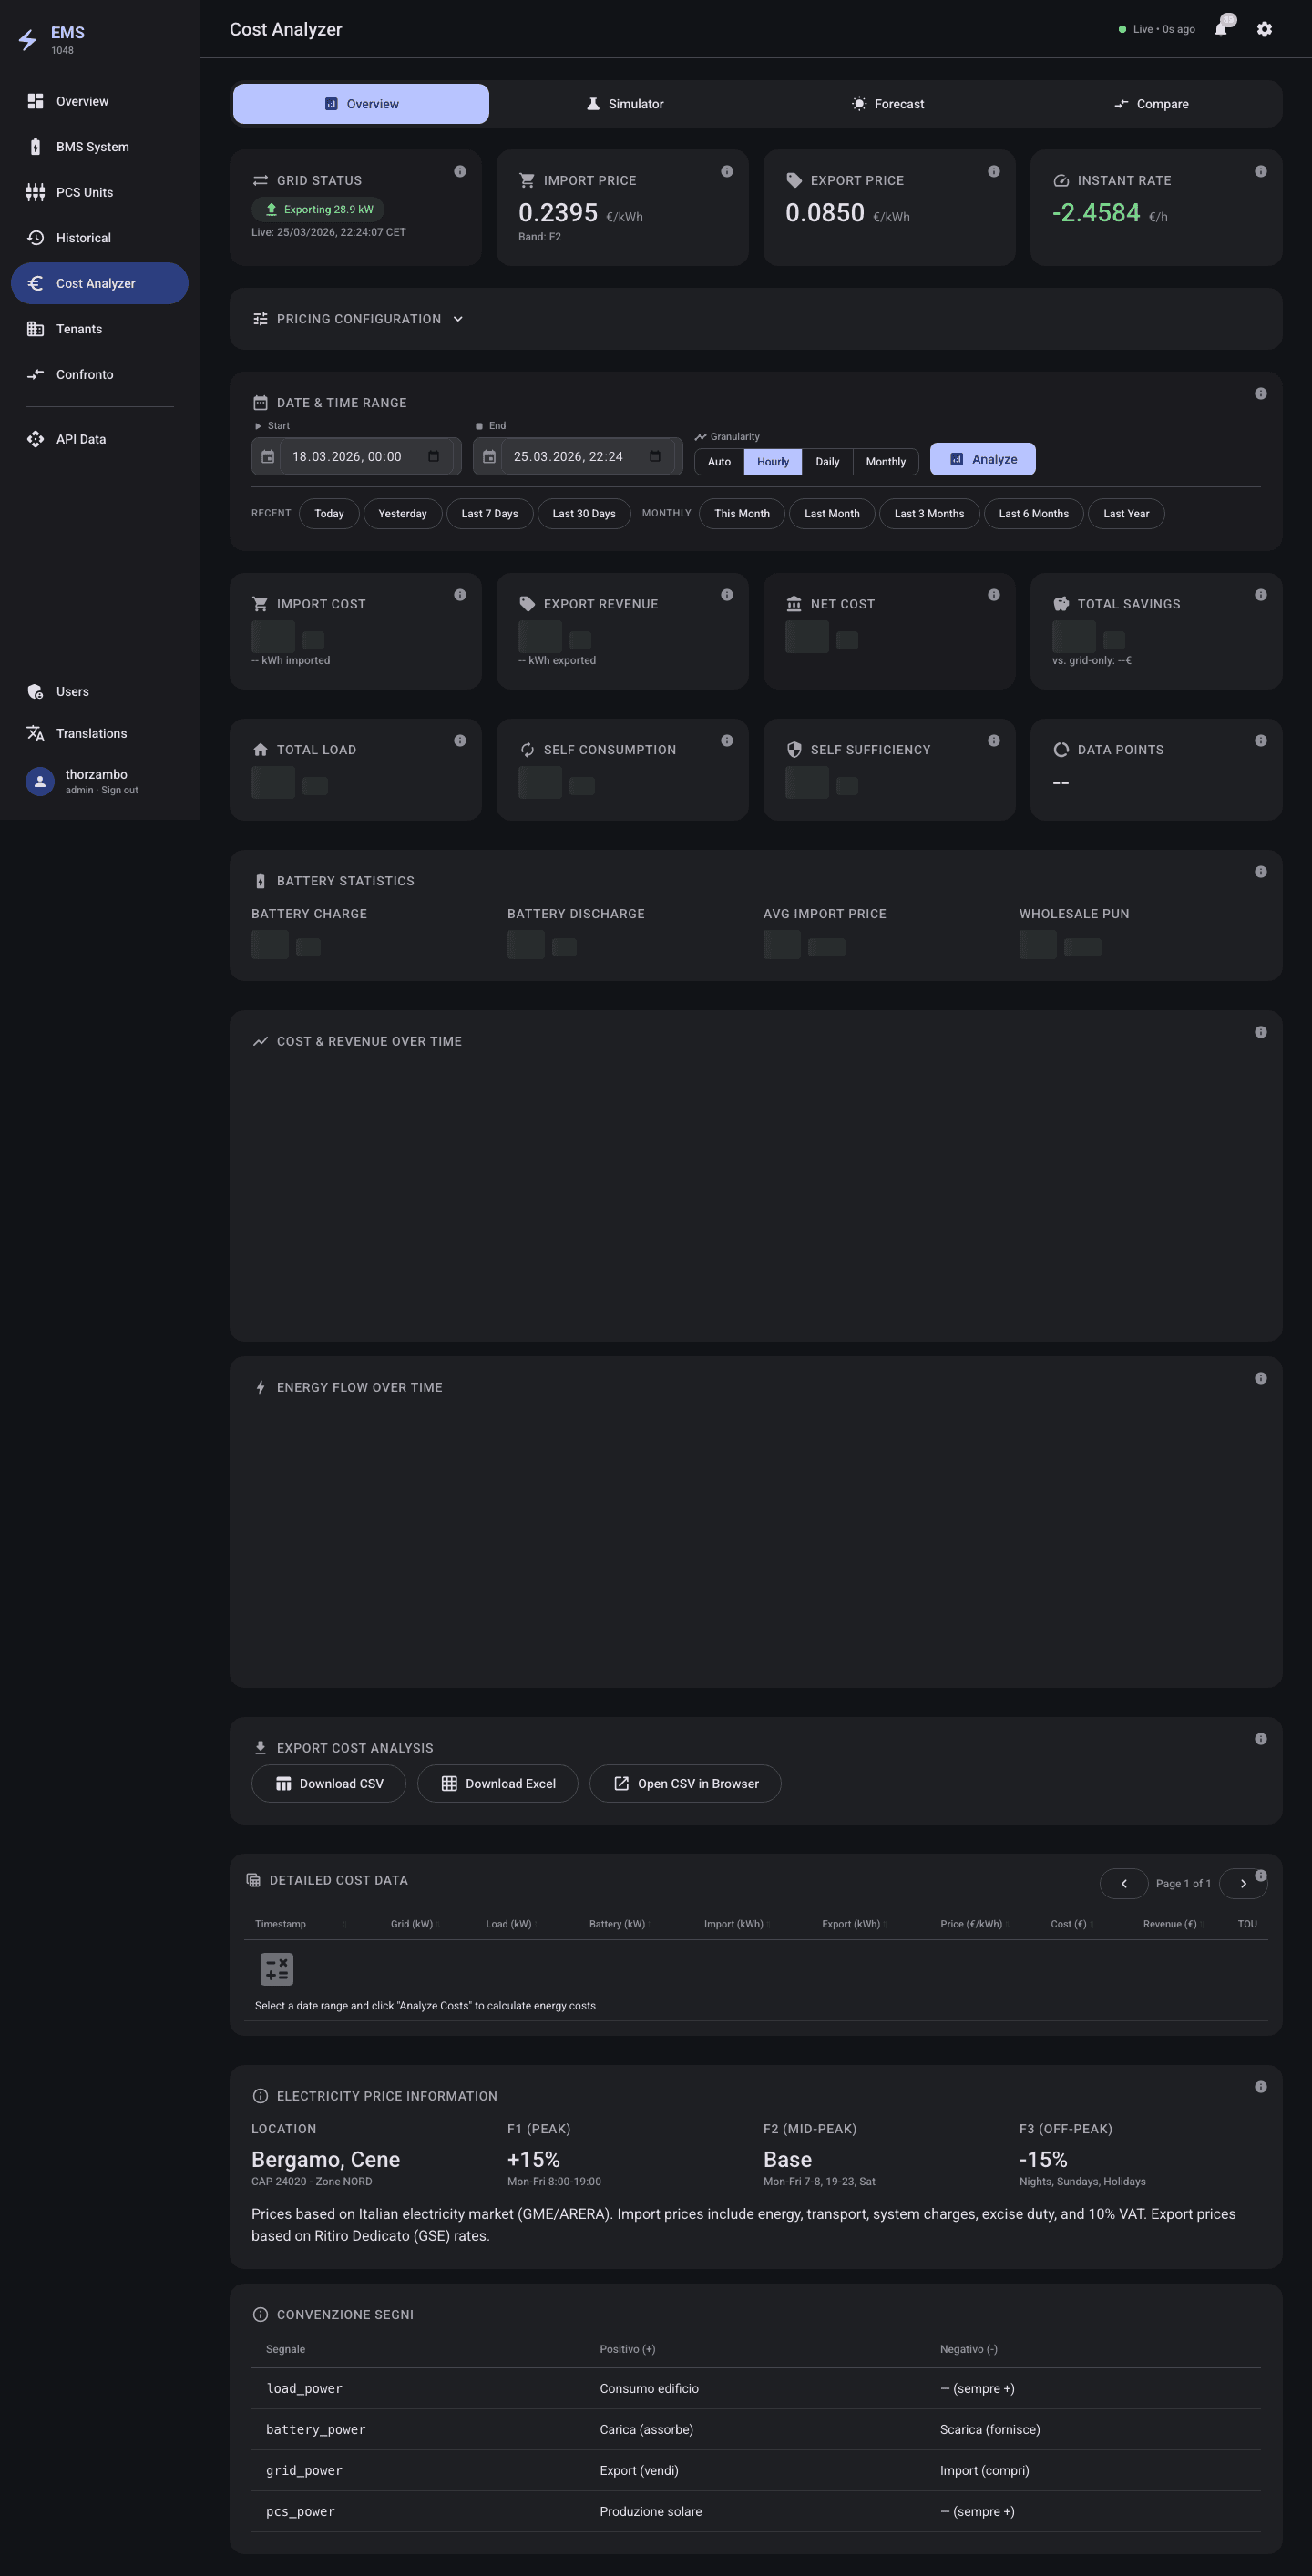
cost and revenue overview
Challenge
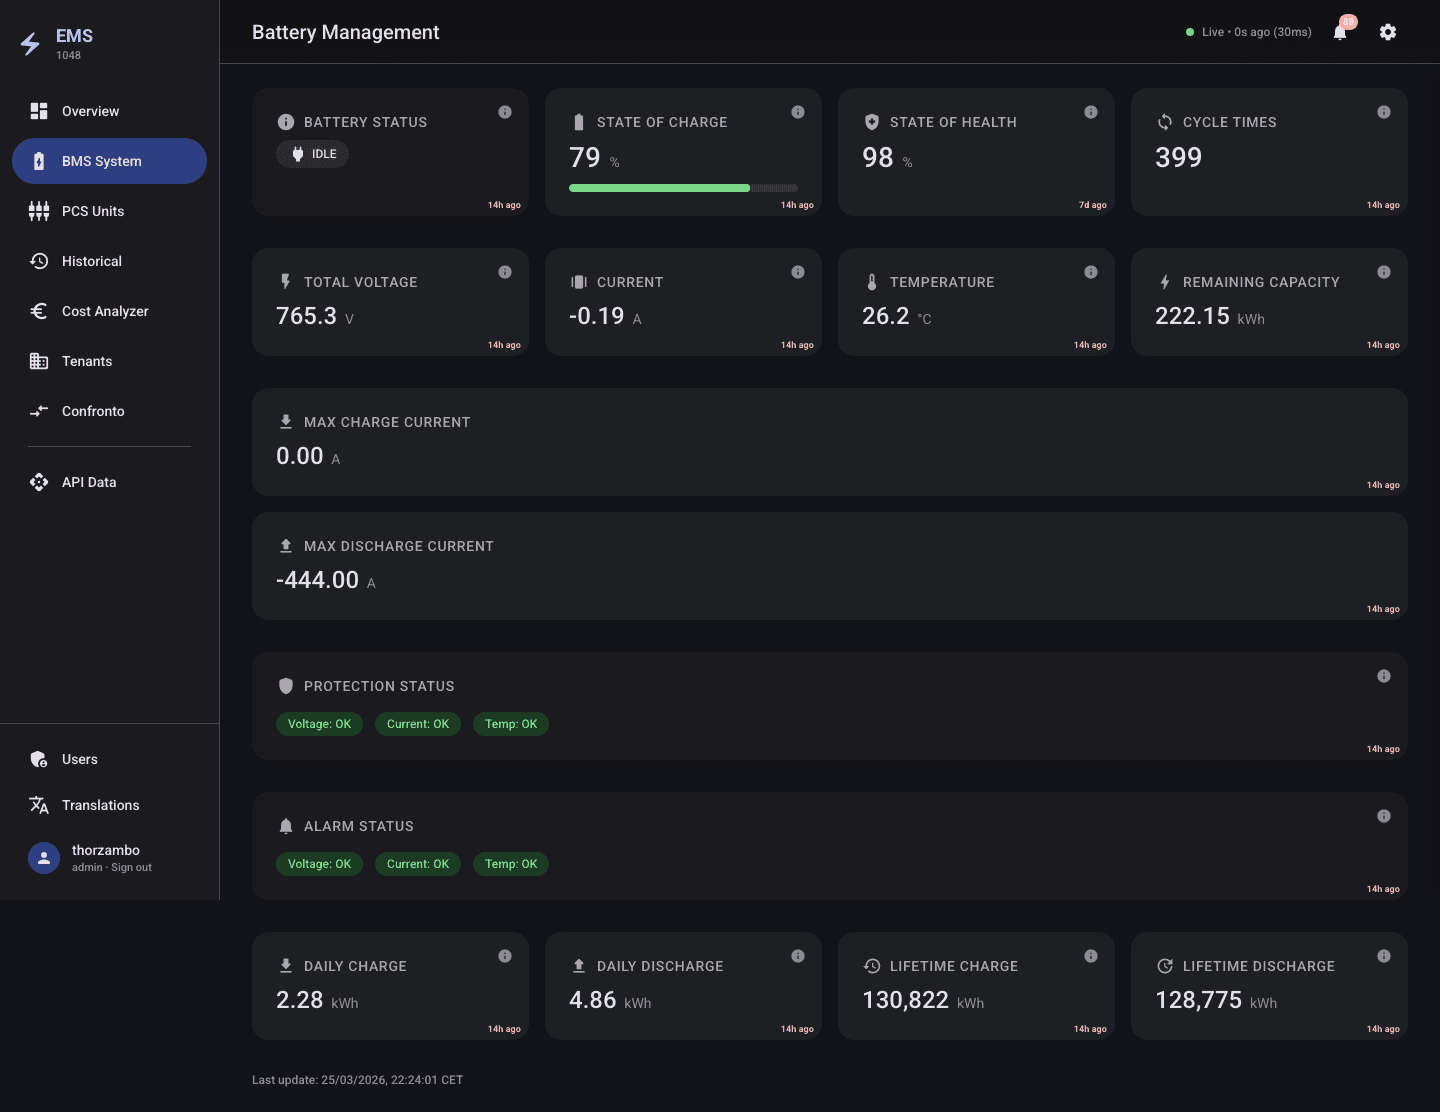
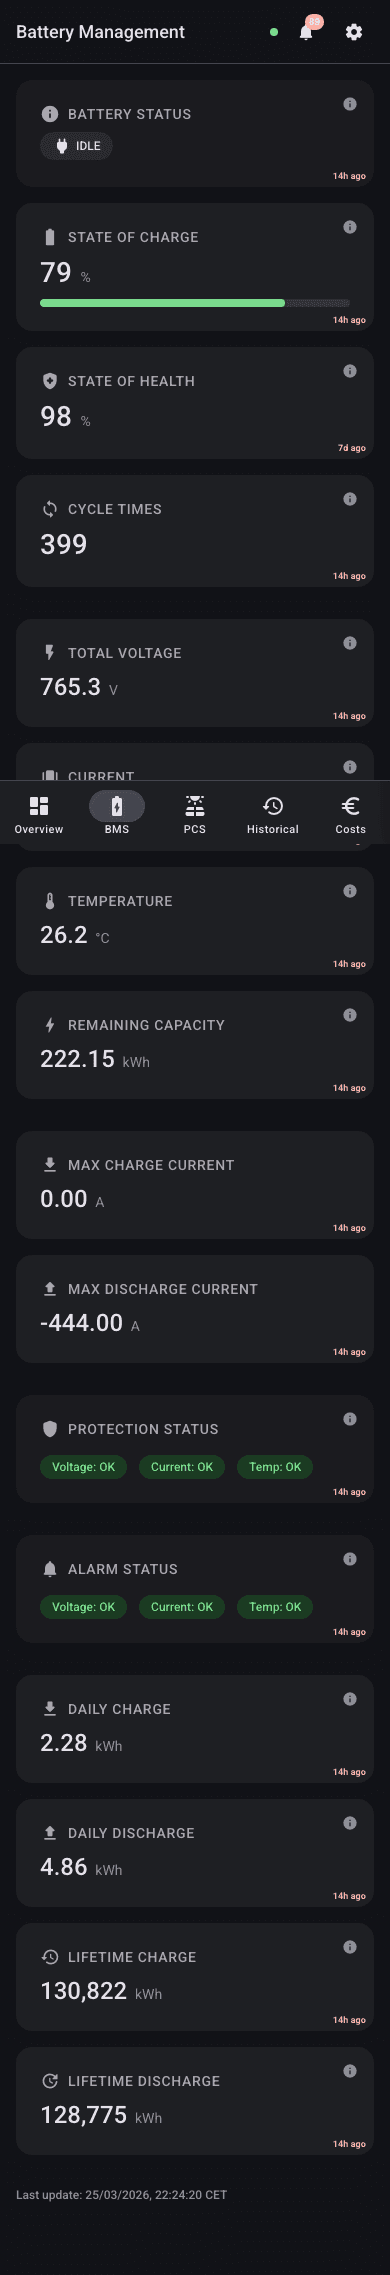
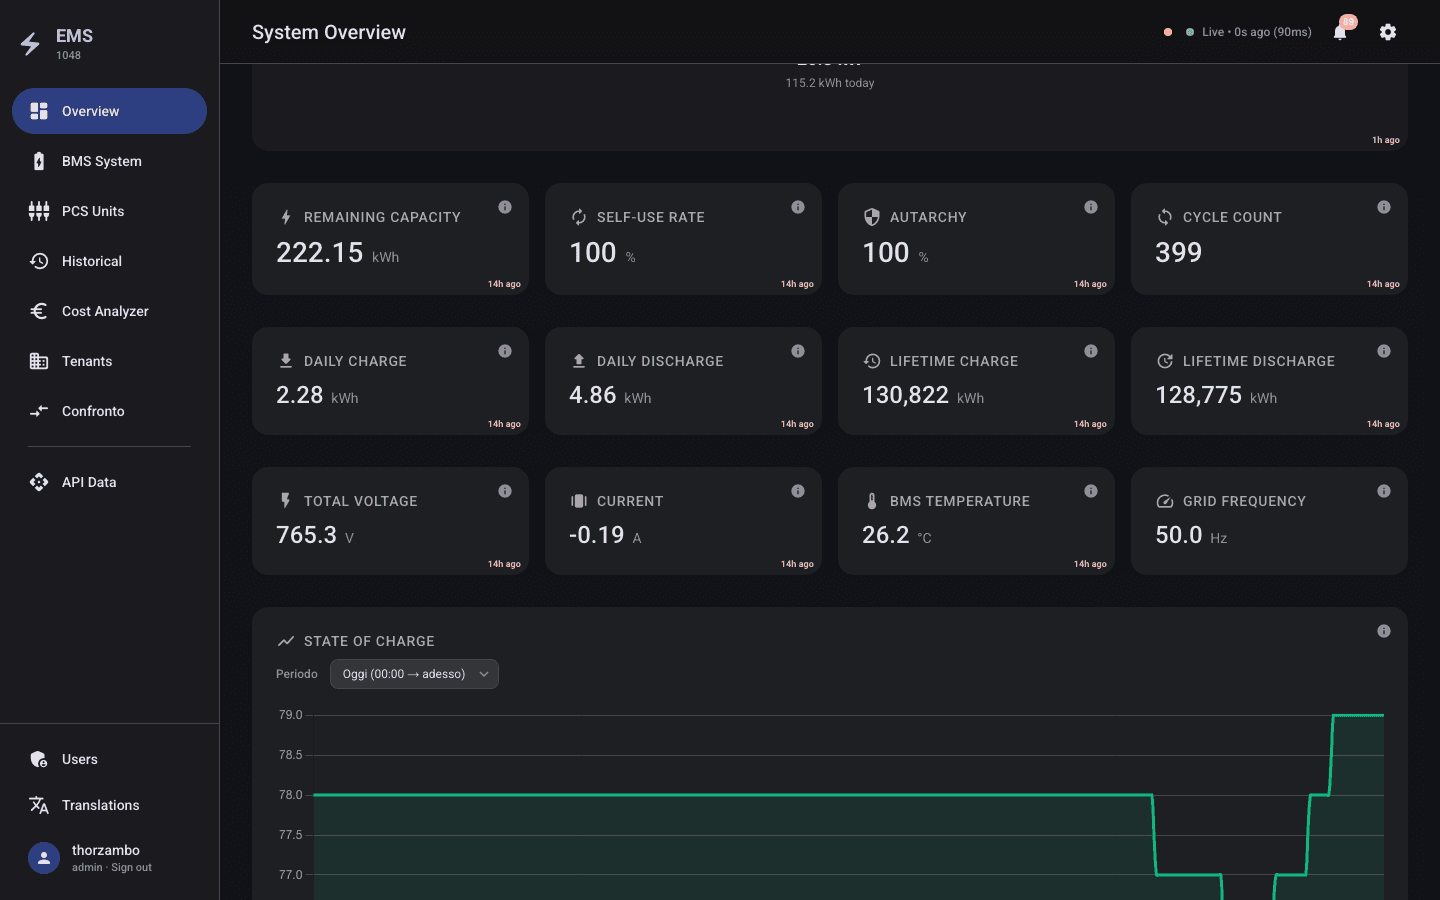
The solar installation produced and consumed energy data, but the raw view made it hard to understand what was happening at a glance: production, consumption, anomalies, costs and revenue were not presented in a user-friendly way.
Solution
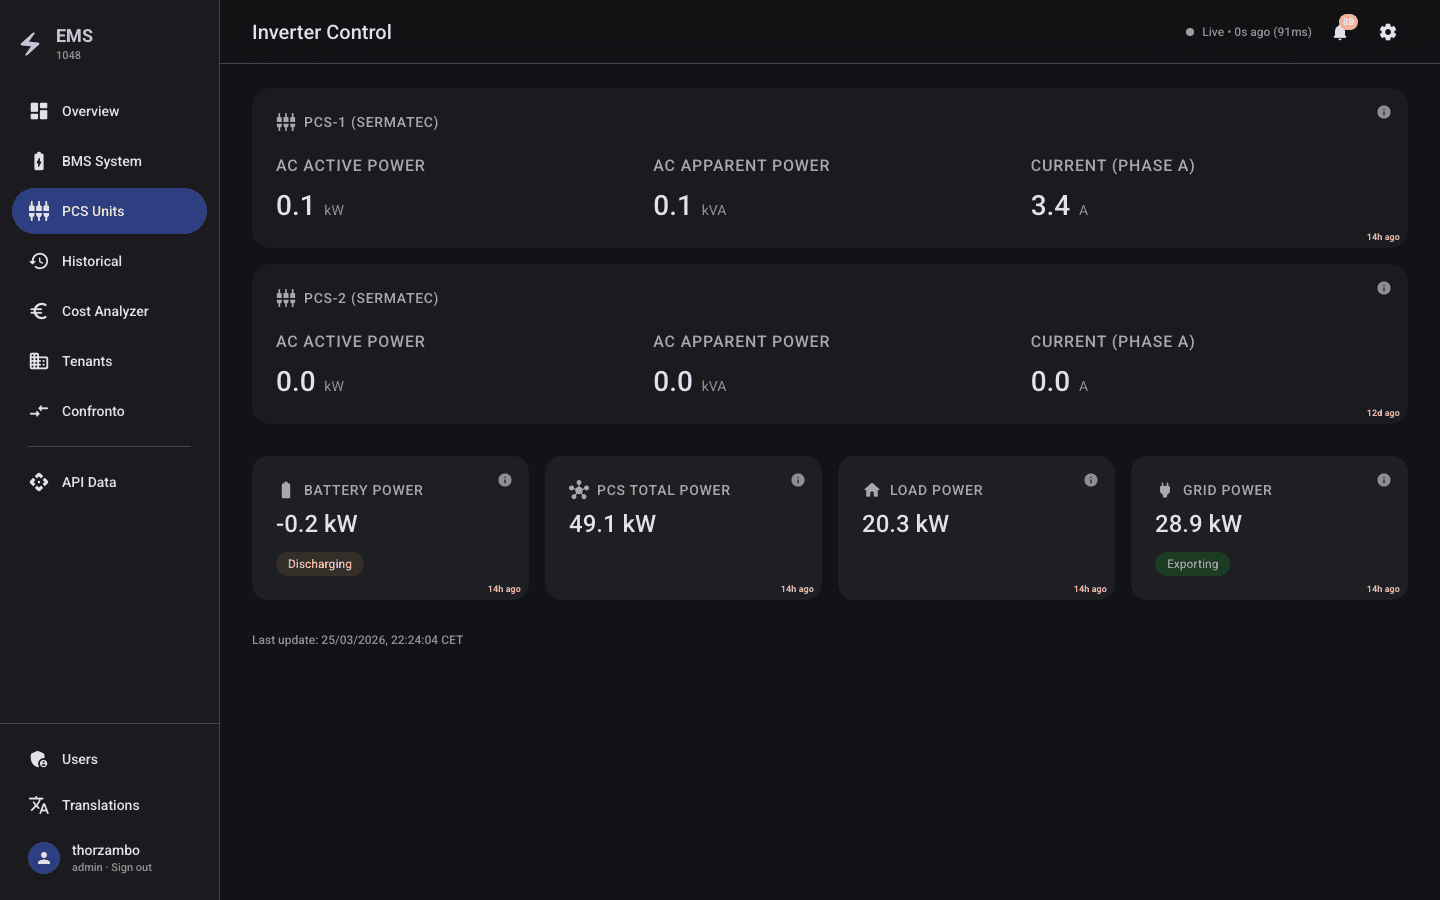
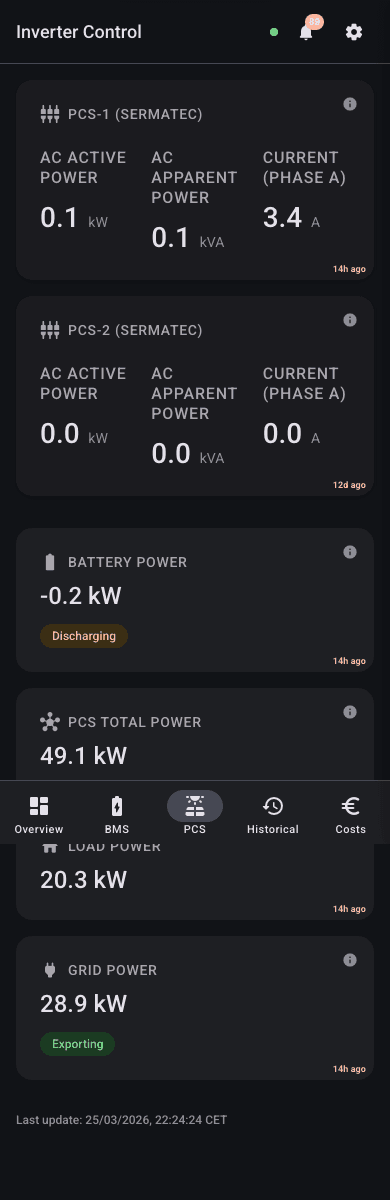
We built a solar dashboard that translated technical production data into a clearer interface, with immediate visibility on energy flows, abnormal behavior, spending and revenue linked to the photovoltaic system.
Results
The Impact
Operators gained an immediate view of problems and anomalies, a more user-friendly understanding of production versus consumption, and a clearer picture of what the solar installation was costing or earning over time.
Gallery
EMS-1048 Solar
EMS-1048 Solar
EMS-1048 Solar
EMS-1048 Solar
EMS-1048 Solar
EMS-1048 Solar
EMS-1048 Solar
Interested in similar results?
Let's discuss your project.